Welcome to the Get Started Guide for first time EDDiE users! This guide takes you 10 minutes to introduce the basic concepts of EDDiE and helps you get started.
Step 1 - Download CSV
We will use a credit dataset in this tutorial, please first download it from here. This dataset classifies people described by a set of attributes as good or bad credit risks.
Step 2 - Create a new project
Project is a workspace where you can collaborate with team members to take a series of tasks which includes but not limit to uploading data, performing ad-hoc analysis, building data pipeline and so on.
When logged into EDDiE, look in the upper-left corner and click on Add Project. We are going to create a Demo Project in this step.
Step 3 - Upload your data and create first module
Now that we have created a new project, let's go to this project and generate our first module.
Module is a sequence of Spark DataFrame operations which takes multiple input DataFrames and generates a single DataFrame.
To create a module, click on Add Module in the Module Editor Page and check Input as module type.
Then click on Upload a csv... from Input File field and upload the csv file you just downloaded in step 1.
This csv file is separated by comma and with a header in the first row. To apply a schema to the input module, please check has-header under CSV Attributes and click on Discover Schema. Feel free to modify column name or column type at this moment or just click on Create to finish module creation. Then you can see your first module in tree view and dependency graph.
Step 4 - Discover your data in Notebook
After module creation, let's move to right-side Notebook area. Firstly, to use EDDiE's notebook, you can see the toolbar on the top. You can also left-click a specific cell, and then right-click the cell to access the cell-level functions and refer to the corresponding short-cuts. For example, we will add a new cell in the notebook:
Leverage the Copy Name functionality to pass module FQN proj.newFile.input to df() function, and run this cell. The result of this module is returned to Spark Dataframe d. Now feel free to run a few simple commands to get a preliminary understanding of data structure.
Step 5 - Perform analysis in Notebook
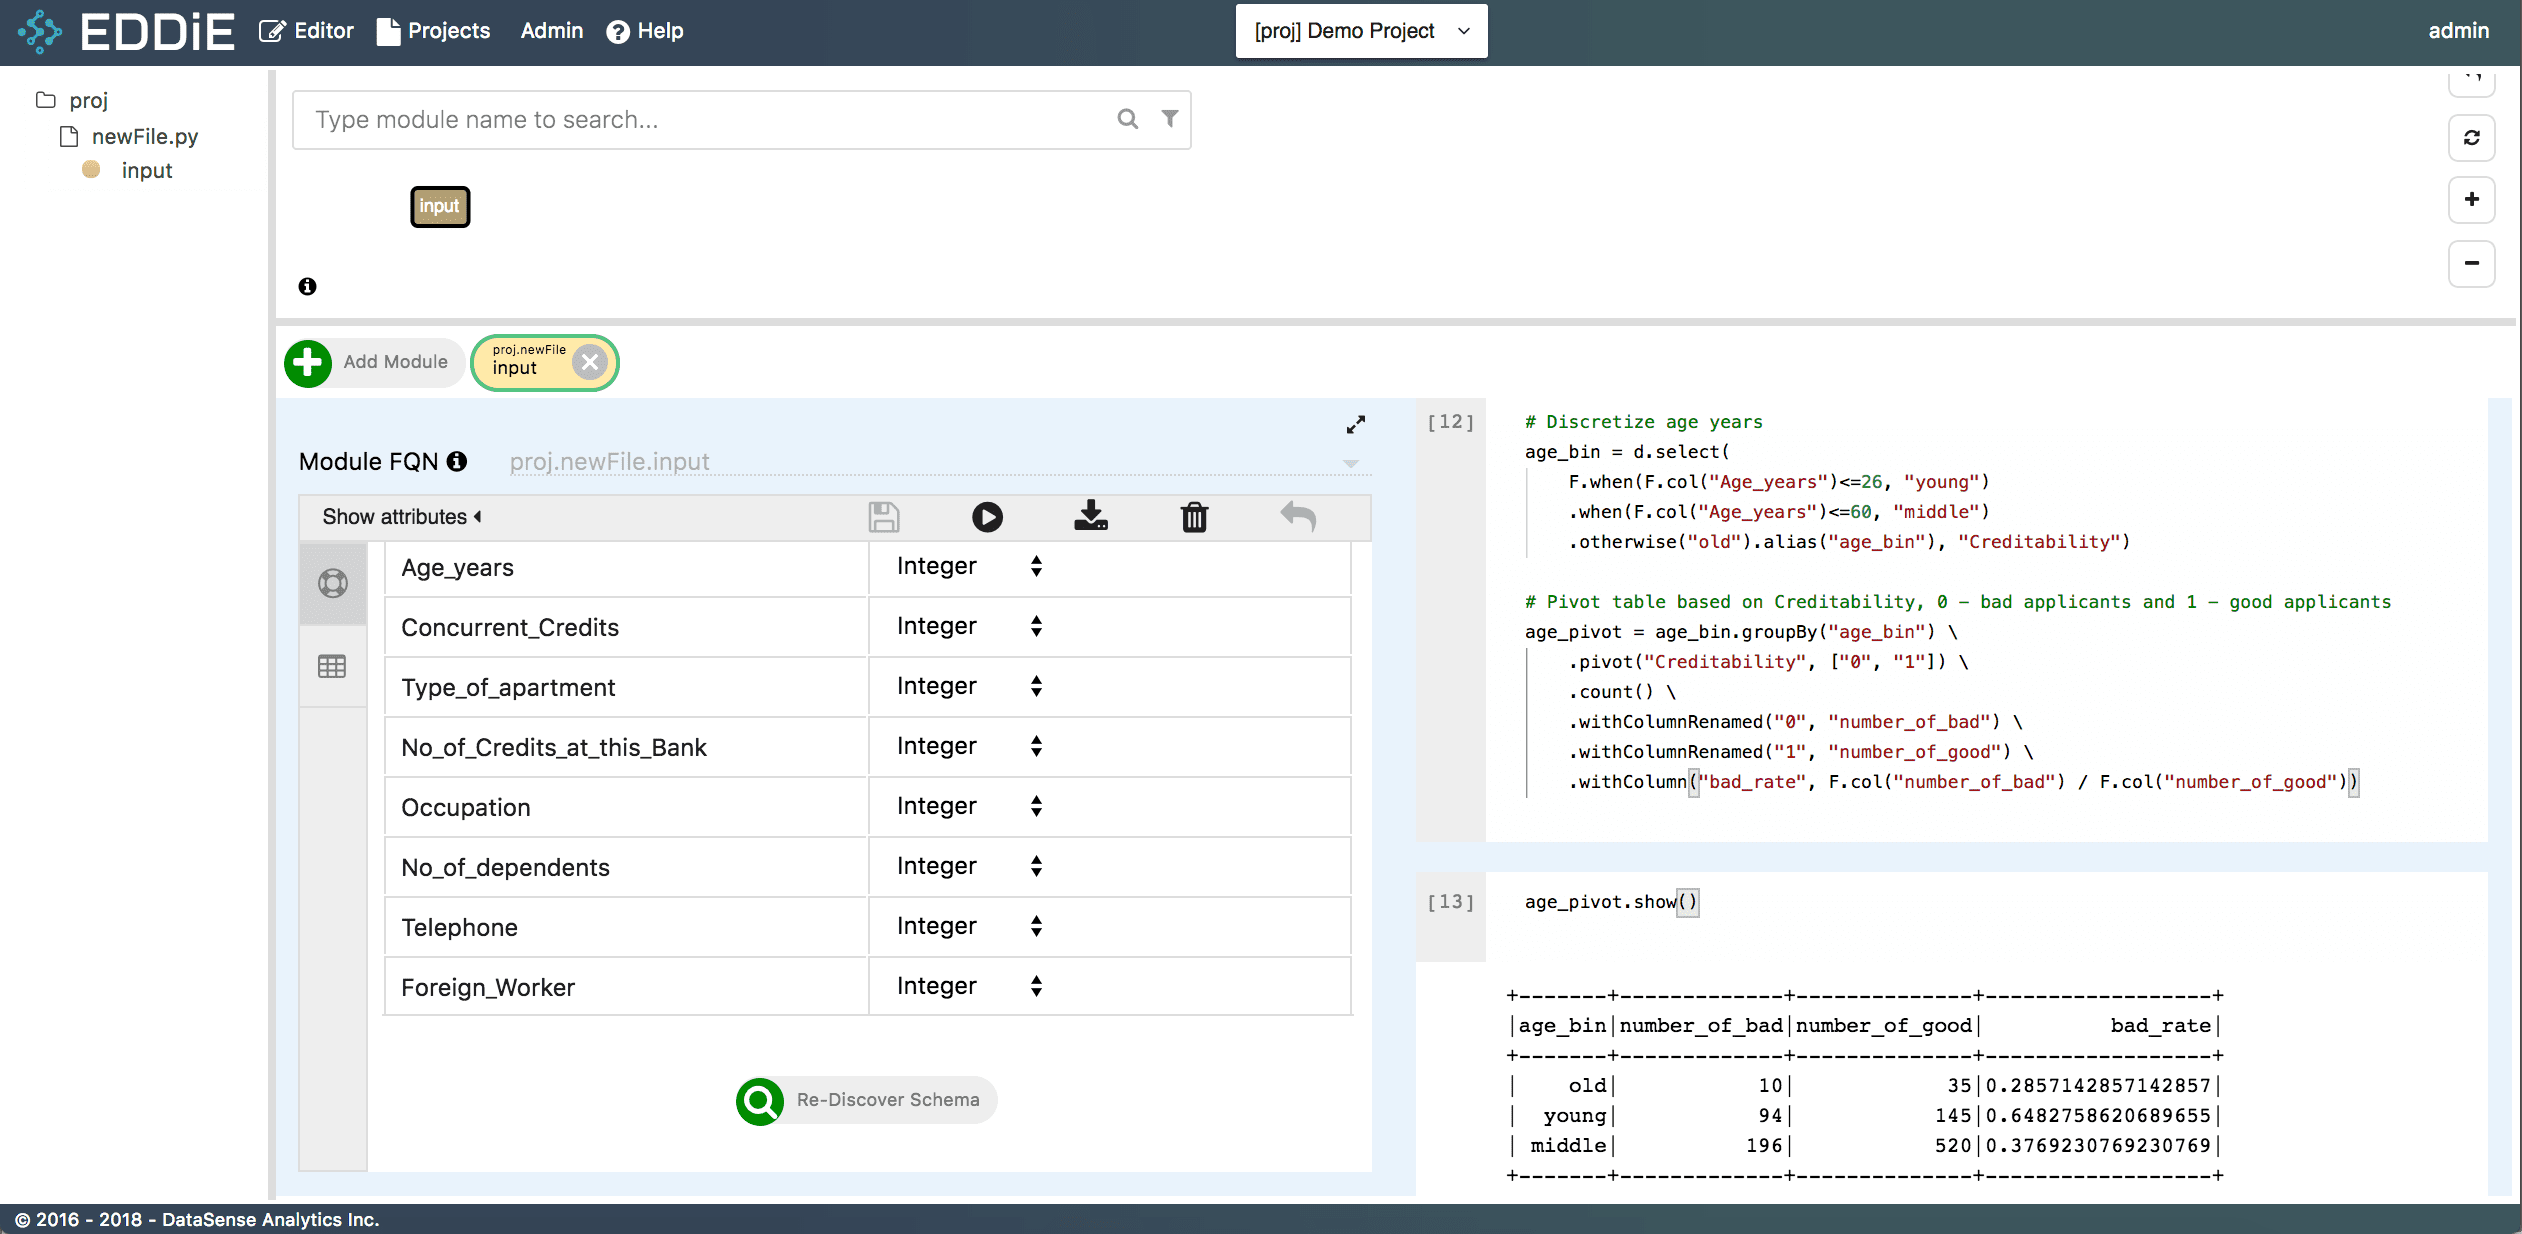
Let's perform some advanced analysis in this step. Please copy and paste below pyspark code to the cell in your Notebook. This bit of code is to create a binning column from age years and check the bad applicants rate across different age buckets.
# Discretize age years
age_bin = d.select(
    F.when(F.col("Age_years")<=26, "young")
    .when(F.col("Age_years")<=60, "middle")
    .otherwise("old").alias("age_bin"), "Creditability")

# Pivot table based on Creditability, 0 - bad applicants and 1 - good applicants
age_pivot = age_bin.groupBy("age_bin") \
    .pivot("Creditability", ["0", "1"]) \
    .count() \
    .withColumnRenamed("0", "number_of_bad") \
    .withColumnRenamed("1", "number_of_good") \
    .withColumn("bad_rate", F.col("number_of_bad") / F.col("number_of_good"))
In the output, you can see the bad applicant rate declines as age grows.
Step 6 - Create another module from Notebook
Although Notebook is a good place for interactive and experimental data science, it is not quite readable and maintainable in production once project gets big and complicated. EDDiE allows you to use chunks of ad-hoc code in Notebook to directly generate modules from a cell and build a scalable and deployable data pipeline easily.
To create another module, right-click a specific notebook cell and select Generate module. Enter a module name, and you can see the main logic has been copied to the left-hand side as a new module.
Then select the correct dataset (proj.newFile.input) as the dependency and modify the corresponding variable in the code, and click on the save button. The new module appears correctly in the dependency graph now.
Step 7 - Run your modules
Once module is created, let's check whether the module result is as expected. There are three ways to run a module in EDDiE
- Click on the button
Run Modulein Module Editor Form - Right click module chip in dependency graph and click on
Run Module - Right click module name in tree view and click on
Run Module
After module finishes running, 10 sample rows (if the number of rows of the final output exceeds 10) are returned and module chip's color becomes darker in dependency graph. If you want to get the complete result, just click on Export to CSV next to Run Module and CSV file will be downloaded to your laptop.
If you run into bugs or need support or wish to make feature requests, please raise an issue here https://github.com/DataSenseAnalytics/PubEddie/issues
That's it to get started. Please review the User Guide for more detailed description of EDDiE's features and functionality.